Solution and Impact
To make an unbiased decision based on a computed risk score, the three steps to consider:
1.) Data collection
2.) Data modelling (generating a risk score)
3.) Optimal decision-making based on risk score
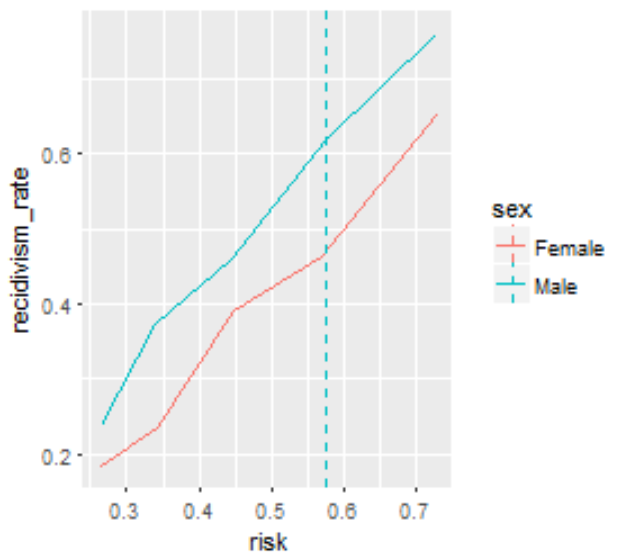
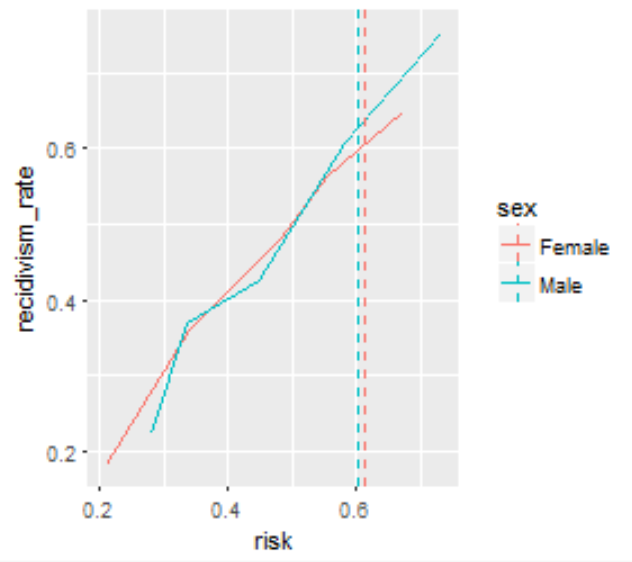
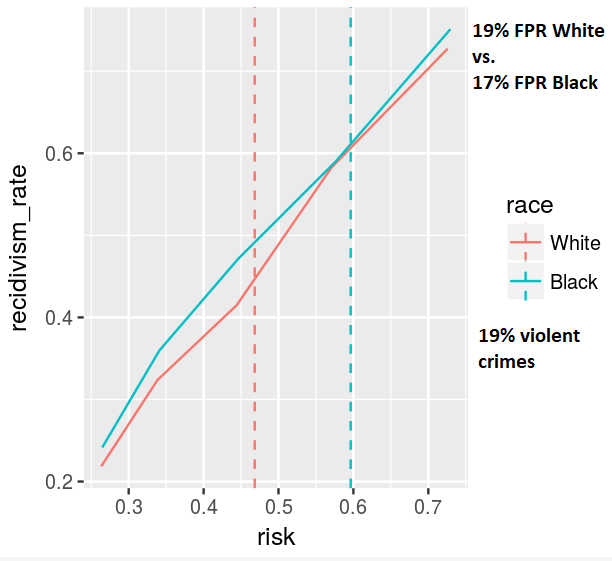
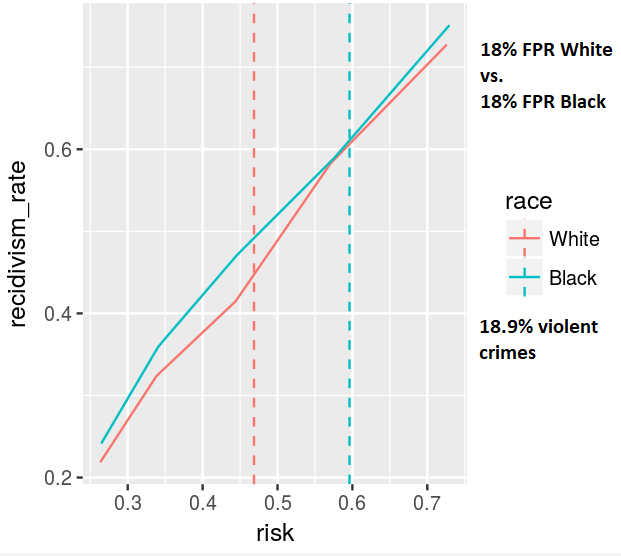
We address the second and third points, showing that adding certain variables to an algorithm can make it more fair and how to make optimal decisions based on different concepts of fairness. By creating interpretable visualizations of these concepts, we hope to make fair, data-driven models easier to understand and adopt.
Team
Sam Corbett-Davies (Stanford)
Danielle Dean (Microsoft)
Lorenzo Vitale (BU)
Aditthya Ramakrishnan (CMU/Next Tech Lab)
Anshuman Pandey (CMU/Next Tech Lab)
Harini Suresh (MIT)
Yunxin Fan (Harvard)
Yaovi Ayeh (Dell EMC)
Frances Ding (Harvard)
Marina S. (community)